Delivery and operations · Operational telemetry and adoption
A dashboard needs an evidence contract
Source-reviewed technical draft. Diagrams and walkthroughs use abstract or invented inputs. Implementation, reported use and measured outcomes remain separate.
When two views show different adoption or savings numbers, the operator has to debug the dashboard before using it. My Command Center contributions span the calculation engine, adoption views, rollups, operational interfaces and the later removal of unsupported telemetry.
That history makes the meaning of the numbers part of the engineering problem.
Put shared math beneath the views
The authored change moved shared eligibility, valuation, daily capping and date bucketing into a calculation core used by several pipelines. Its contribution record includes fixtures and parity snapshots so the migration could distinguish preserved behavior from intended metric changes.
The inspected engine uses Eastern calendar buckets. It values a log from a retained hours_saved value when present, otherwise from a configured action rate and quantity. Unknown actions value at zero. A per-user daily cap limits credited hours; it is an anomaly-control policy, not an observation of a person's workday.
My case study keeps modeled savings separate from elapsed time measured against a baseline. A consistent calculation can still produce an estimate. Defaults, overrides, excluded users, legacy environment fields and invalid timestamp fallback all affect interpretation. In this snapshot, a missing environment is treated as legacy production, and an invalid or missing date can fall back to the current day.
Those limits belong beside the metric.
Deduplicate both sides of adoption
The adoption diff in authored changes addressed a quieter inconsistency: active users were deduplicated across tools, but target counts could be summed repeatedly. The inspected implementation uses a union of target identities only when every contributing target list agrees with its numeric count. If any list is incomplete, the whole stage falls back to the legacy summed target count.
Inspect the system diagram
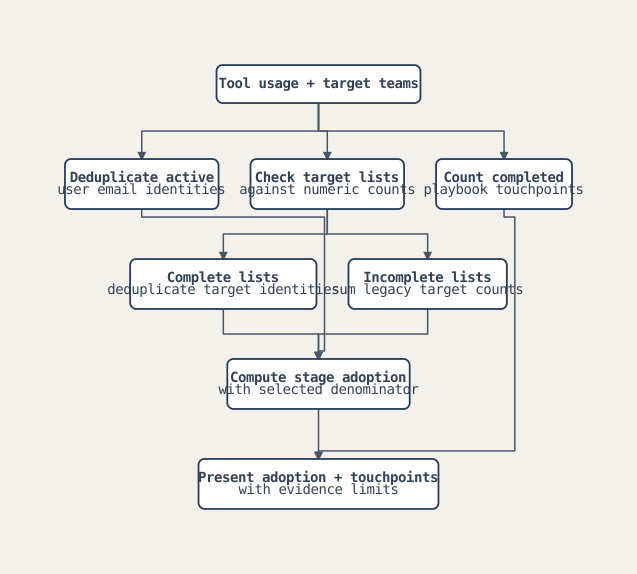
Carl models and SVGs. The fallback preserves a computable denominator; it does not prove unique audience coverage.
I would explain that fallback before quoting the percentage. Mixing a deduplicated target union for some tools with summed counts for others would obscure the denominator's meaning. The implementation makes a stage-wide choice. It also counts playbook touchpoints separately: completed outreach or onboarding steps are not evidence of product usage.
A percentage needs a known denominator. The same rule applies to operational status.
Removing plausible-looking defaults
My later history includes both dashboard feature expansion and evidence remediation. The authored change replaced particular generated health samples with reads from retained health history. That is a specific source change; it does not establish that every dashboard value became independently trustworthy.
The September fixes go further. In the authored change, selected diffs remove hardcoded active/target user values and fabricated fallback tool counts. The authored change records simulation disclosure and random-walk chart removal. The authored change removes the fabricated insights route and its consumers.
An unavailable measurement needs a visible state.
The authored change introduces neutral unknown/unverified handling. Its notification view changes a missing success rate from an optimistic default to an unknown value. The authored change removes composite score displays and connects selected underlying metrics.
My the authored change adds checks for random data, optimistic fallbacks and architecture drift. The inspected script is advisory and always exits zero. It is useful review assistance, but it does not enforce a blocking release gate or prove the absence of fabricated data.
Synthetic denominator and unknown-state review
I use three invented users and two invented tools; these are not agency adoption measurements.
- Tool A targets
{a, b}and tool B targets{b, c}. Both numeric target counts are two and both lists are complete. - Active usage contains
{a, b}. The target union has three identities, so the stage calculation uses two active users over three targets, rounded by the implementation. - Tool B loses its explicit list while keeping a numeric target count of two. The stage uses the legacy summed denominator of four; that result has a different evidence basis.
- A notification success-rate query is unavailable. The remediated display presents unknown rather than a fabricated 100%.
- An action log receives configured modeled hours. The dashboard can aggregate that value, but the example supplies no independent time-saving experiment.
What the contribution proves
My record supports shared calculation work, denominator reconciliation, clearer operational presentation and specific telemetry corrections. It does not establish the dashboard's ROI claims, total realized savings, a measured uptime improvement or collection-wide data integrity. Open diagnostic/error work remains outside completed implementation claims.
Discussion notes
Three-minute outline. show the conflicting denominator, trace shared valuation, then explain why unknown must survive the UI.
Questions to prepare. What is measured versus modeled? What happens with incomplete audience lists? Does a daily cap improve truth or only bound an estimate? Why is the audit advisory?
Application summary. My Command Center contributions reconciled calculation and adoption semantics across operational views. Later work removed unsupported telemetry and preserved unknown states so dashboards did not turn missing evidence into reassuring numbers.
This contribution narrative is supported by privately held source and authorship records. It contains original explanations and abstract diagrams, without employer code, customer records or runtime telemetry. Missing outcome evidence stays explicit.