Integrations and shared platform · Shared data, model and runtime services
Shared services that preserve the meaning of an outcome
Source-reviewed technical draft. Diagrams and walkthroughs use abstract or invented inputs. Implementation, reported use and measured outcomes remain separate.
I contributed shared API context, model-response handling and notification telemetry across Atlas. The problem was consistency between tools: an error needs usable context, a model response needs the intended content, and a notification log needs a meaning that survives different producers.
The shared service should make that meaning easier to inspect.
The authored change moves user-context resolution into the API wrapper and attaches the resolved user for downstream handling. It also avoids sending a second response after headers have already been sent. The wrapper supplies context; individual route guards still decide what a user is allowed to do. I do not describe automatic context resolution as universal authorization enforcement.
The inspected August wrapper also separates validation errors from server failures, uses the shared logging services and supports configured rate and scope checks. Those options apply when a consumer opts into them. Source inspection does not establish that every route does so.
Keep model content distinct from other parts
The authored change changes a Vertex response helper to join text parts that are not marked as thought content. The patch handles a concrete response-shape concern in a shared adapter.
I keep the fallback visible.
The selected implementation can use a response-text fallback when the preferred parts do not produce content. This is a particular adapter correction, not proof that every Atlas model route filters the same way or validates every generated object. The auditor and Research Assistant chapters explain their own output and evidence boundaries.
One event vocabulary, several producers
The authored change connects notification definitions, configuration, telemetry and selected producers. The registry defines tools, event identifiers, labels, channels and routing metadata. Default configuration derives selected labels and channel choices from that registry instead of duplicating each definition independently.
I would start a debugging demonstration with the event identifier.
The telemetry service enriches a record with registry information and runtime environment. It normalizes legacy event names and timestamp formats so older records can be inspected alongside newer ones. Selected records can retain routing hashes, consumer IDs and delivery IDs, connecting a notification outcome to the decision that produced it.
Inspect the system diagram
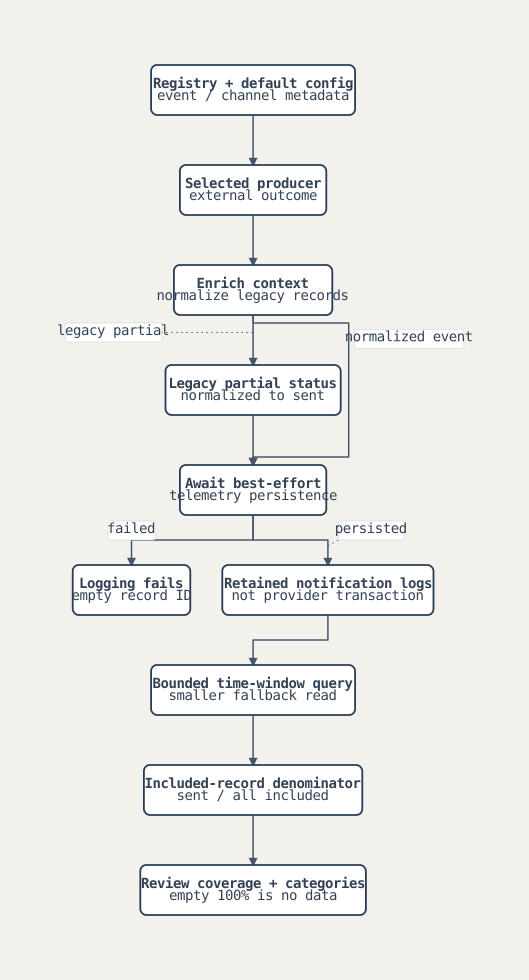
Normalization also changes interpretation. The inspected service maps several legacy statuses, including partial, to sent. Its metrics use a bounded query, with a smaller unordered fallback if the indexed query fails, then filter by time. A window can therefore be incomplete. The reported rate is sent records divided by all included records, including skipped or suppressed records, and an empty window can report 100%.
That is a dashboard convention, not a delivery SLA.
Telemetry writes are awaited but non-throwing: the service returns an empty identifier when persistence fails. This avoids turning a logging failure into the producer's primary error, but leaves an evidence gap. There is no shared transaction tying provider acceptance to a telemetry row. I would explain those tradeoffs before presenting the dashboard as an exhaustive delivery record.
Invented evidence walkthrough
- Give a fictional route a resolved user context and show the separate tool-permission decision.
- Reconstruct a model response with visible text and a marked thought part. Show the selected helper's extraction and fallback boundary.
- Normalize an invented legacy notification into a registered event with a timestamp.
- Compare a partial legacy status with the resulting sent category.
- Display three invented included records and calculate the dashboard's denominator.
- Reconstruct a telemetry-write failure after provider acceptance. Explain the missing evidence rather than calling it a failed delivery.
This sequence uses toy records and does not contact providers or run a model.
Result and personal contribution
The authored patches establish shared context, adapter and notification-service contributions. I can trace the concrete contracts and the selected consumers. I do not claim complete instrumentation coverage, measured reliability, notification delivery rates or whole-platform service ownership.
My application story is about making automation observable across different tools. A useful dashboard preserves enough context to investigate an outcome, and its summary needs an honest account of normalization, missing records and query coverage.
Discussion notes
Three-minute outline. context versus permission; model-part extraction; registry and legacy normalization; the metrics denominator; a missing telemetry row after acceptance.
Questions to prepare. Which states should remain distinct? What should happen when logging fails? How do you report incomplete query coverage? Where does model schema validation belong? How do event contracts evolve without erasing history?
Application summary. I contributed shared API, model-response and notification services that make operational outcomes inspectable across tools. I can show the event context and failure boundaries, including why a dashboard category or empty success percentage cannot stand in for complete delivery evidence. That supports debugging customer automation after deployment.
This contribution narrative is supported by privately held source and authorship records. It contains original explanations and abstract diagrams, without employer code, customer records or runtime telemetry. Missing outcome evidence stays explicit.